DynaMut - Help
Help! Try using the key arrows in your keyboard or the buttons below to switch among the tips below.
Main page
About Dynamut
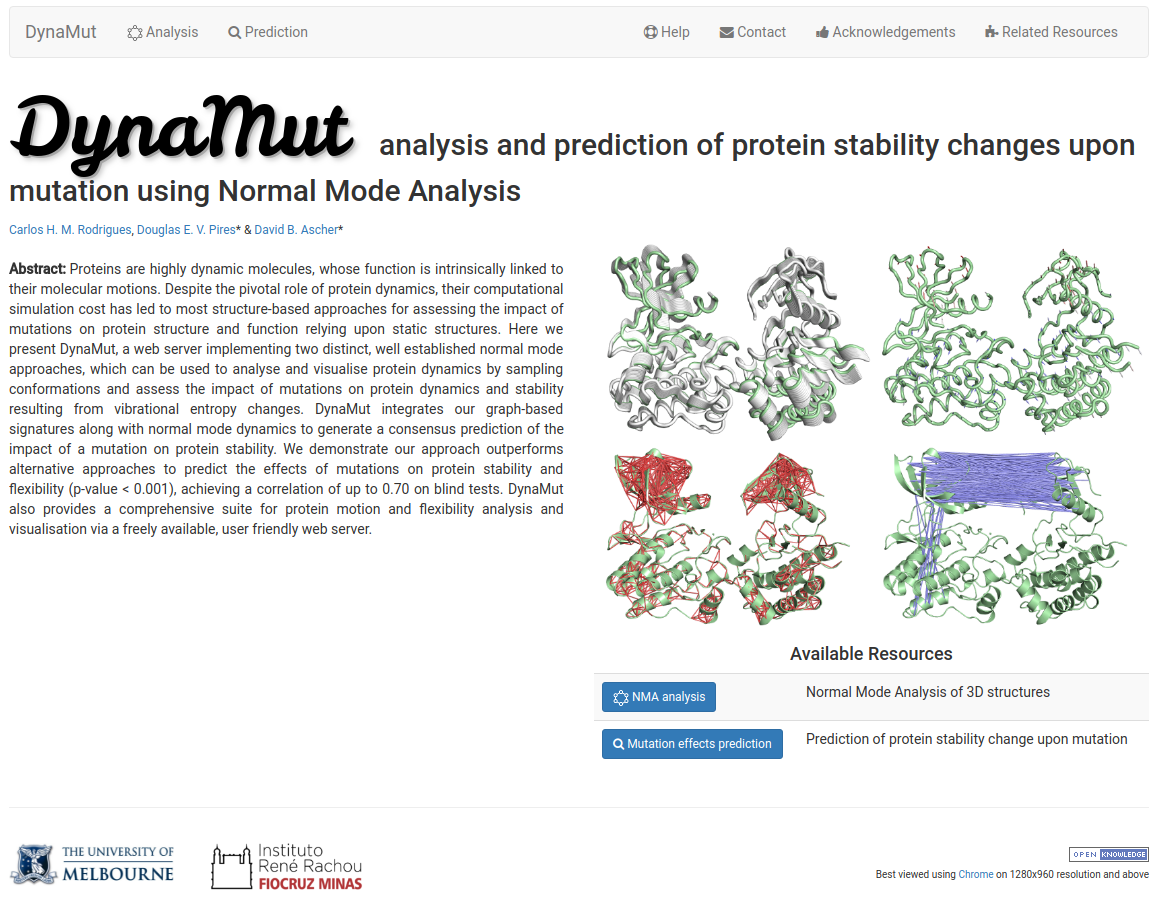
DynaMut is a user friendly web server that implements two distinct well established normal mode approaches, which can be used to analyse protein dynamics by sampling conformations as well as assess the impact of mutations on protein stability and dynamics.
To study the dynamic nature and the role of flexibility/rigidity and accessible conformational landscapes in proteins is essential for understanding their function, as well as to evaluate how changes in a protein might impact its structure, function and interactions, giving rise to different phenotypes.
NMA Analysis Submission page
How to submit a structure to be analyzed
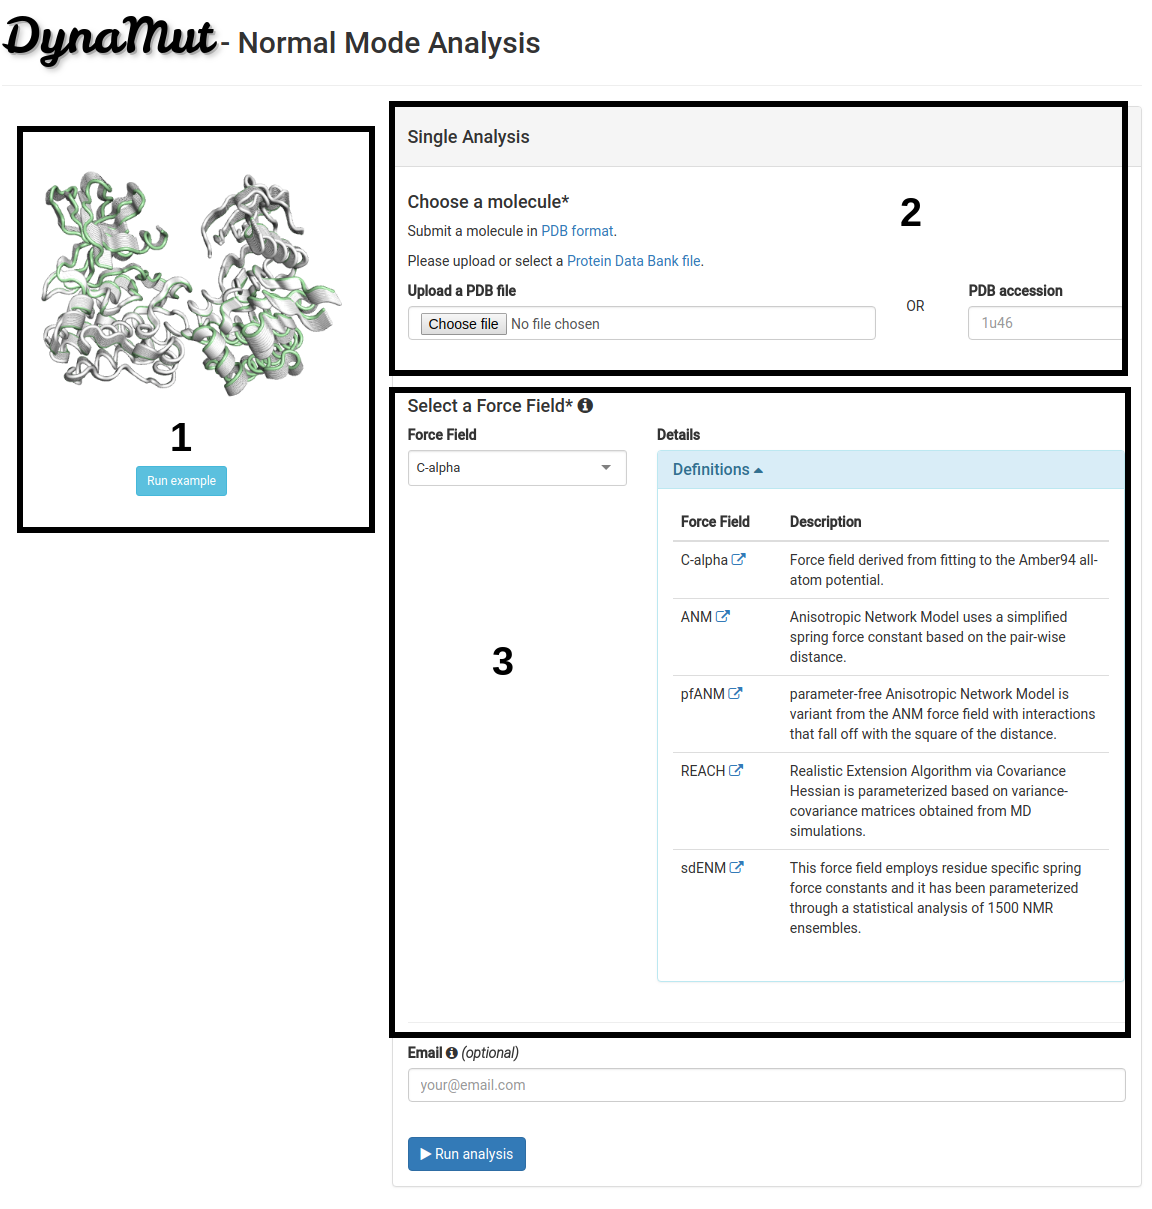
On the analysis submission page:
- Users should provide a wild-type structure (2) by uploading a file in PDB format or providing a PDB accession code.
- A force field should also be provided (3). The Normal Mode Analysis available on DynaMut is based on the bio3D package that uses the C-alpha force field by default. However, no specific force field is strictly recommend. The options available are described below. For more information please access the specific manuscript for each option.
- An example (PDB:1U46 - Tyrosine Kinase ACK1) is also provided (1). Protein kinase transition state from active to inactive and vice-versa require that the protein presents a minimum flexibility no matter if the kinase is activated or not. This transitional state is directly affected by the molecule flexibility.
NMA Analysis results page
Porcupine plots
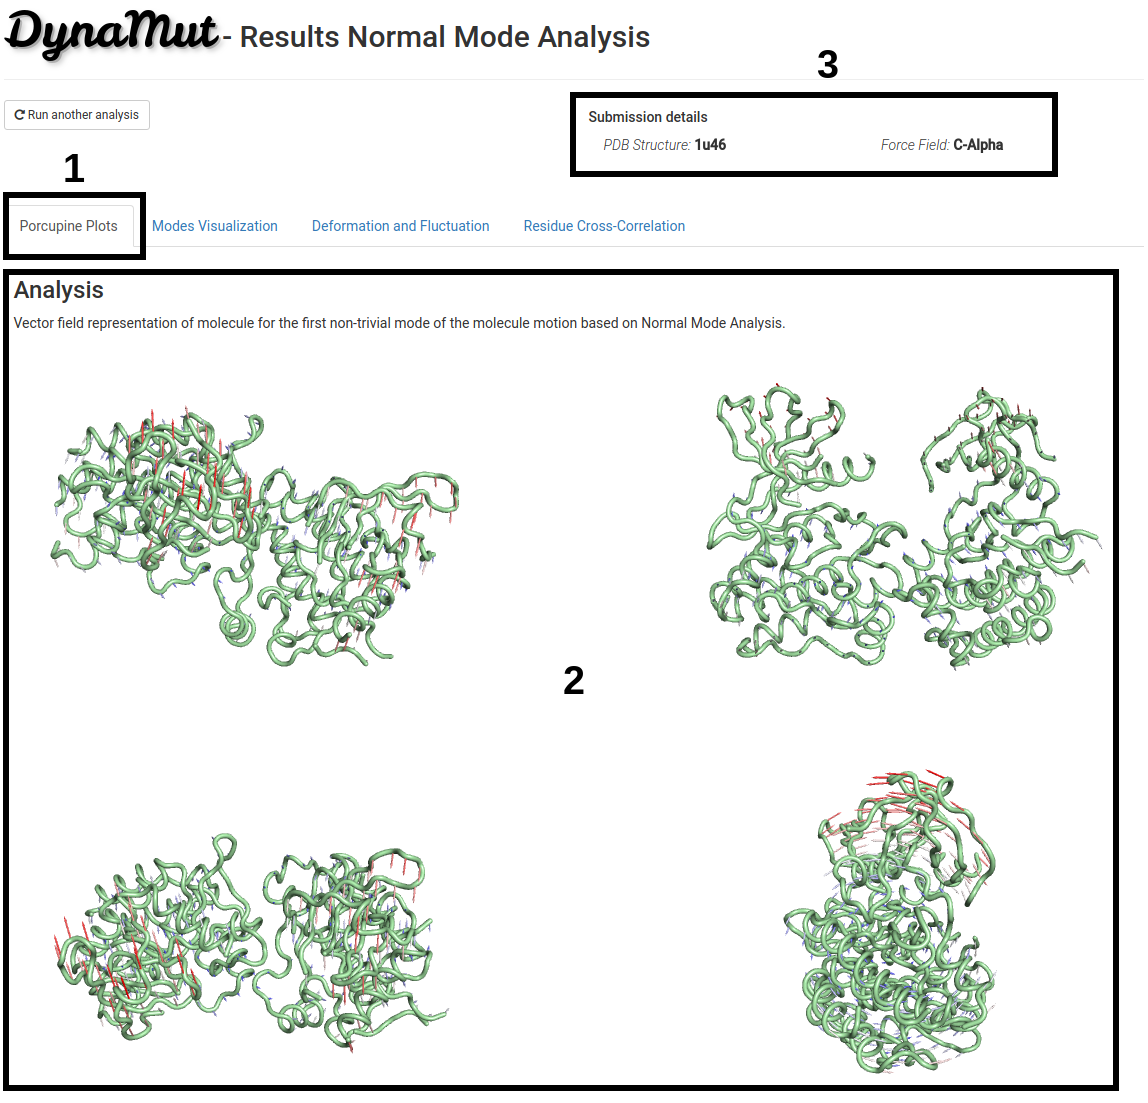
On the first section of the analysis results page:
- Vector field representation of molecule (Porcupine plot) for the first non-trivial mode of the molecule motion based on Normal Mode Analysis is available under the Porcupine Plots tab (1).
- Four images of the same structure from different angles are provided (2).
- Since processing time may vary depending on the structure submitted, the submission details are provided on the top-right of the page (3).
- All the images, pymol session and eigenvectors/eigenvalues used to generate them are available for download.
- All results will be available for 7 days after the job is processed.
NMA Analysis results page
Modes Visualization
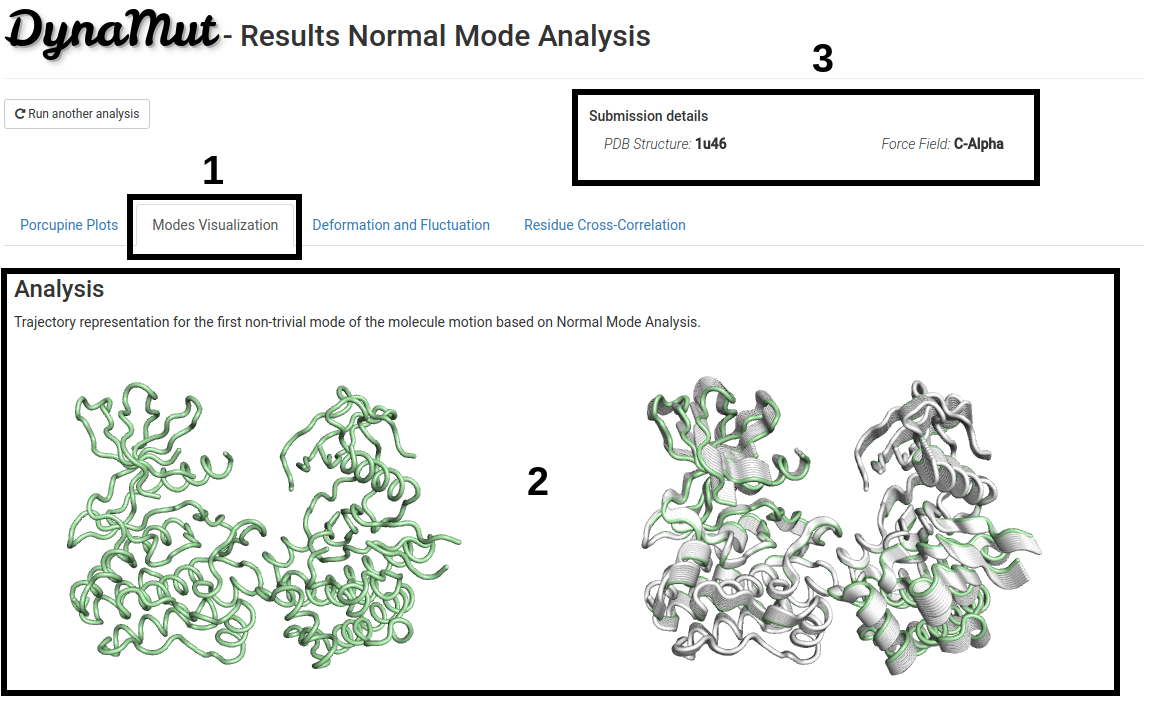
On the second section of the analysis results page:
- Trajectory representation for the first non-trivial mode of the molecule motion based on Normal Mode Analysis is available under the Modes Visualization tab (1).
- An animation simulating the protein motion is showed on the left and the superimposition of the modes are showed on the right side (2).
- Since processing time may vary depending on the structure submitted, the submission details are provided on the top-right of the page (3).
- All the images, pymol session and vibrational frequencies are available for download.
- All results will be available for 7 days after the job is processed.
NMA Analysis results page
Deformation and Fluctuation Analysis
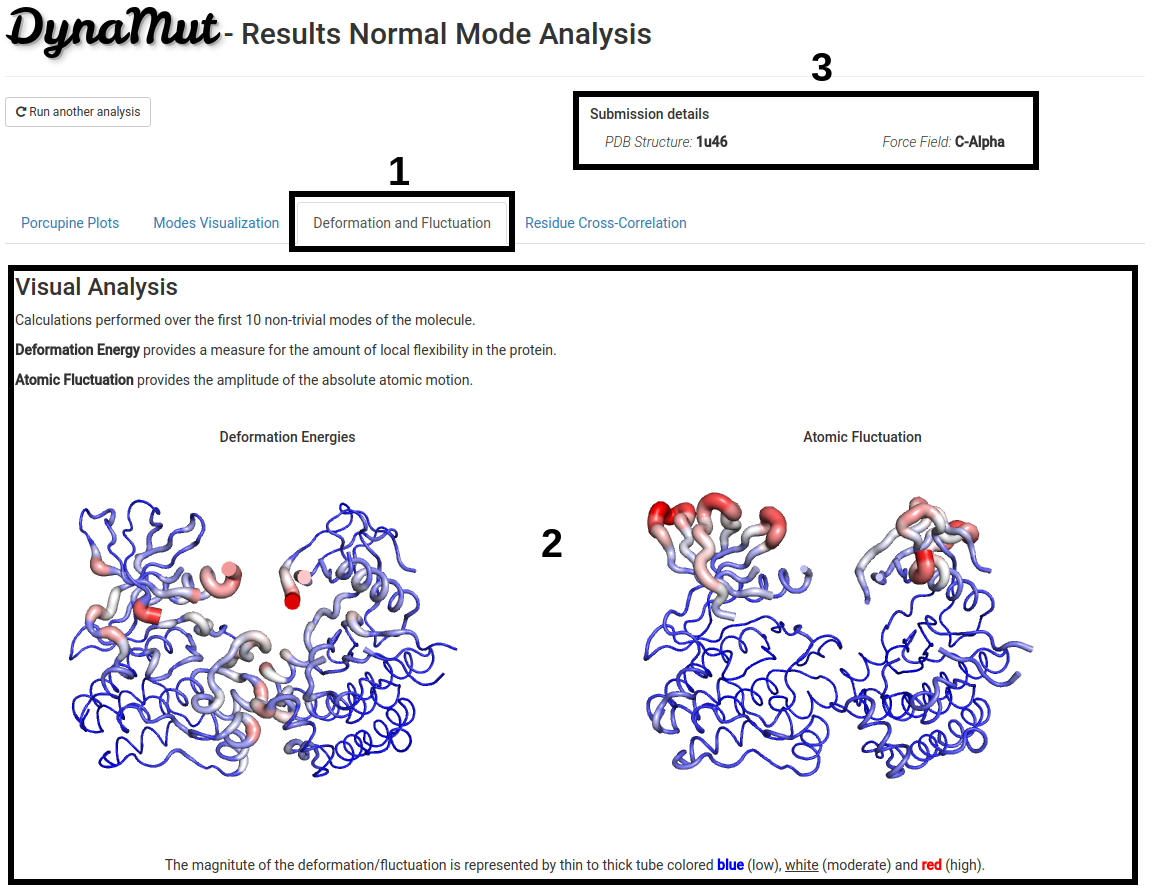
On the third section of the analysis results page:
- On the Deformation and Fluctuation tab (1) is shown visual representations of deformation energy (a measure of the amount of local flexibility in the protein), on the left, and atomic fluctuation (the amplitude of the absolute atomic motion), on the right, calculated over the first 10 non-trivial modes of the molecule.
- 3D representation of deformation energies and atomic fluctuation (2). The magnitute of the deformation/fluctuation is represented by thin to thick tube colored blue (low), white (moderate) and red (high).
- Since processing time may vary depending on the structure submitted, the submission details are provided on the top-right of the page (3).
- All the images, pymol session and raw data file used to generate the 3D representations are available for download.
- All results will be available for 7 days after the job is processed.
NMA Analysis results page
Residue Cross-Correlation Analysis
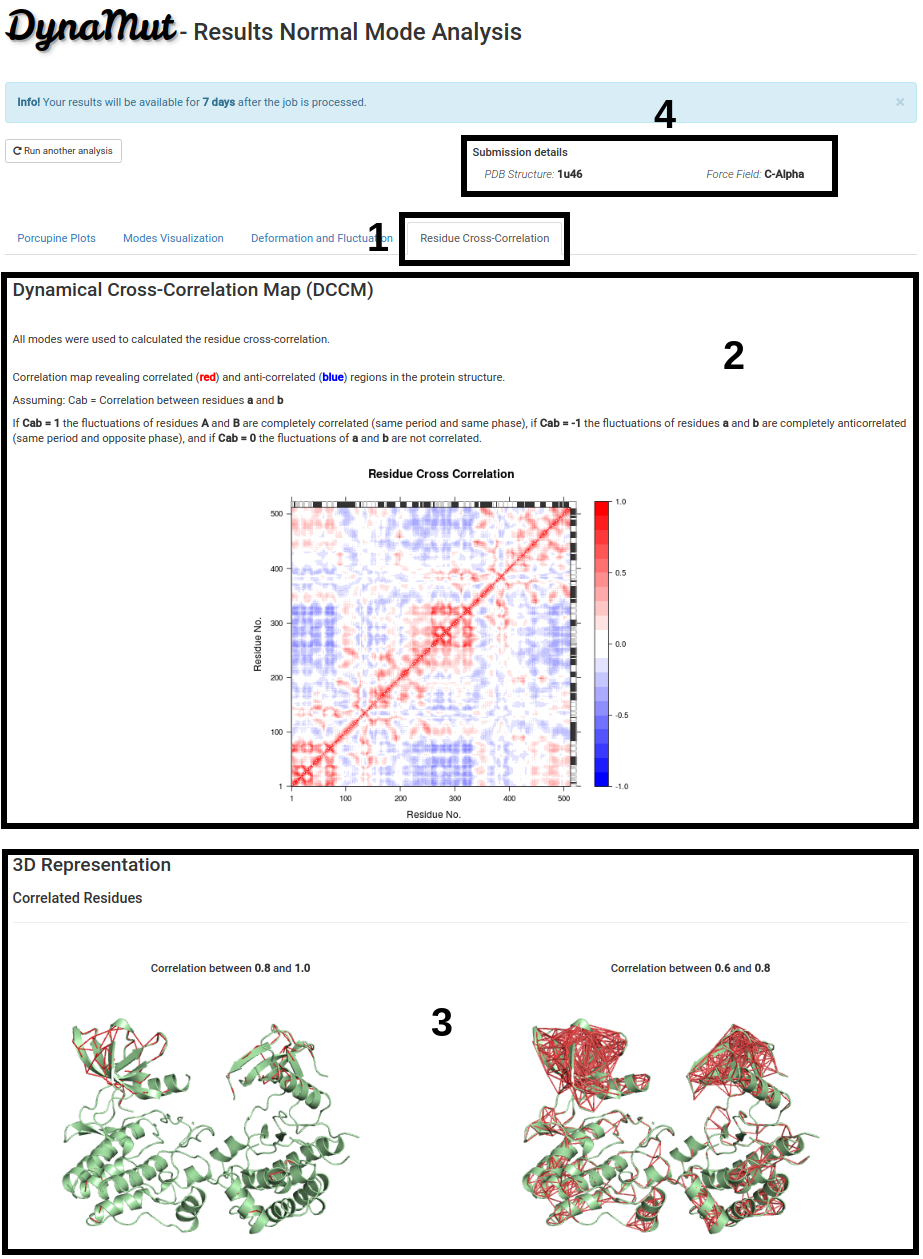
On the Residue Cross-Correlation tab (1):
- Correlation map revealing correlated (red) and anti-correlated (blue) regions in the protein structure are displayed on the Dynamical Cross-Correlation Map (DCCM) (2).
- 3D representation of the correlated and anti-correlated residues (3). Each image shows a different range of correlation.
- Since processing time may vary depending on the structure submitted, the submission details are provided on the top-right of the page (4).
- All the images, pymol session and the correlation matrix used to generate the 3D representations are available for download.
- All results will be available for 7 days after the job is processed.
Prediction Submission page
How to run a prediction
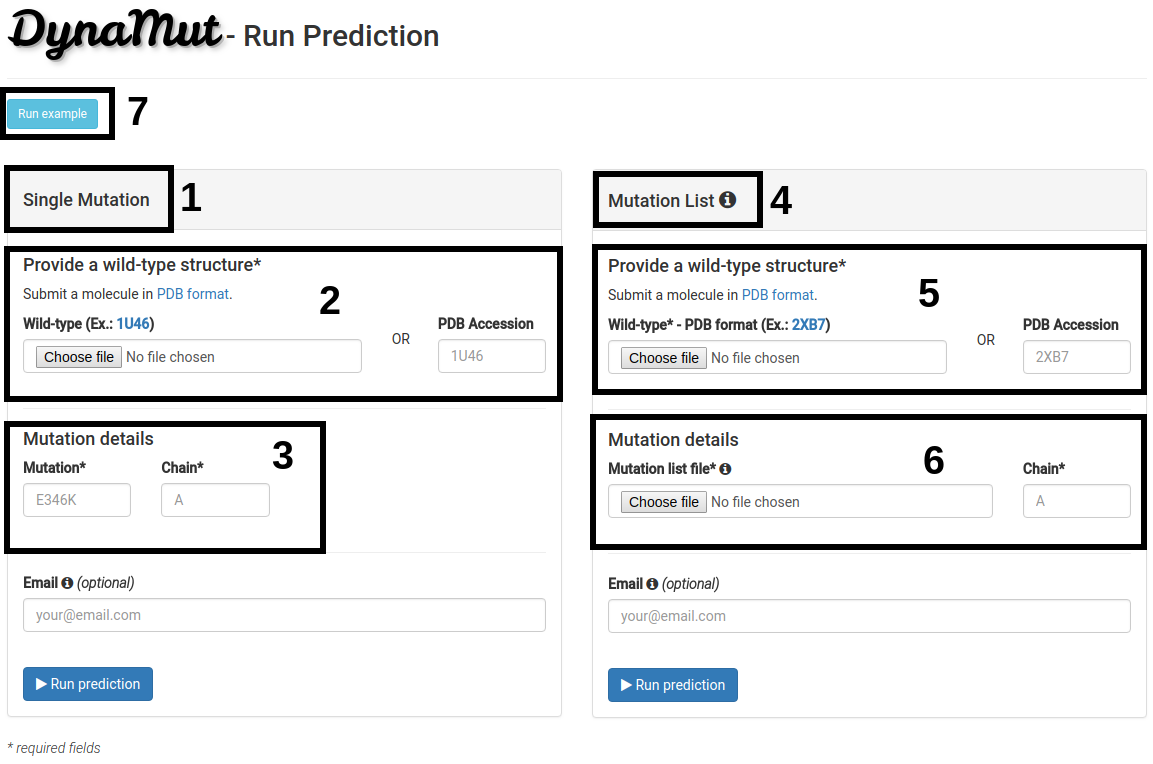
On the prediction submission page:
- The Single mutation option (1) allows the user to submit one single mutation for prediction.
- Users should provide a wild-type structure (2) by uploading a file in PDB format or providing a PDB accession code.
- Details on the single mutation should be provided (3). A mutation code consists of wild-type code, residue position and mutant code (using the one letter amino acid code). Residue position must be consistent with the PDB file. The chain for the mutation code must also be provided.
- The Mutation list option (4) allows users to submit multiple mutations to be analyzed by Dynamut.
- Similarly to the Single mutation option, a wild-type structure must be provided (5) by uploading a file in PDB format or providing a PDB accession.
- Users must provide a list of mutations (6) by uploading a file containing the mutation codes (wild-type residue code, residue position and mutant residue code). The file format requires one mutation per line. In addition, a chain identifier, must also be provided.
- In both options, if an email is provided, a link to the results page will be sent to the user when DynaMut finishes processing the submission.
- An example is also provided (7).
Prediction Results page
ΔΔG Predictions Results
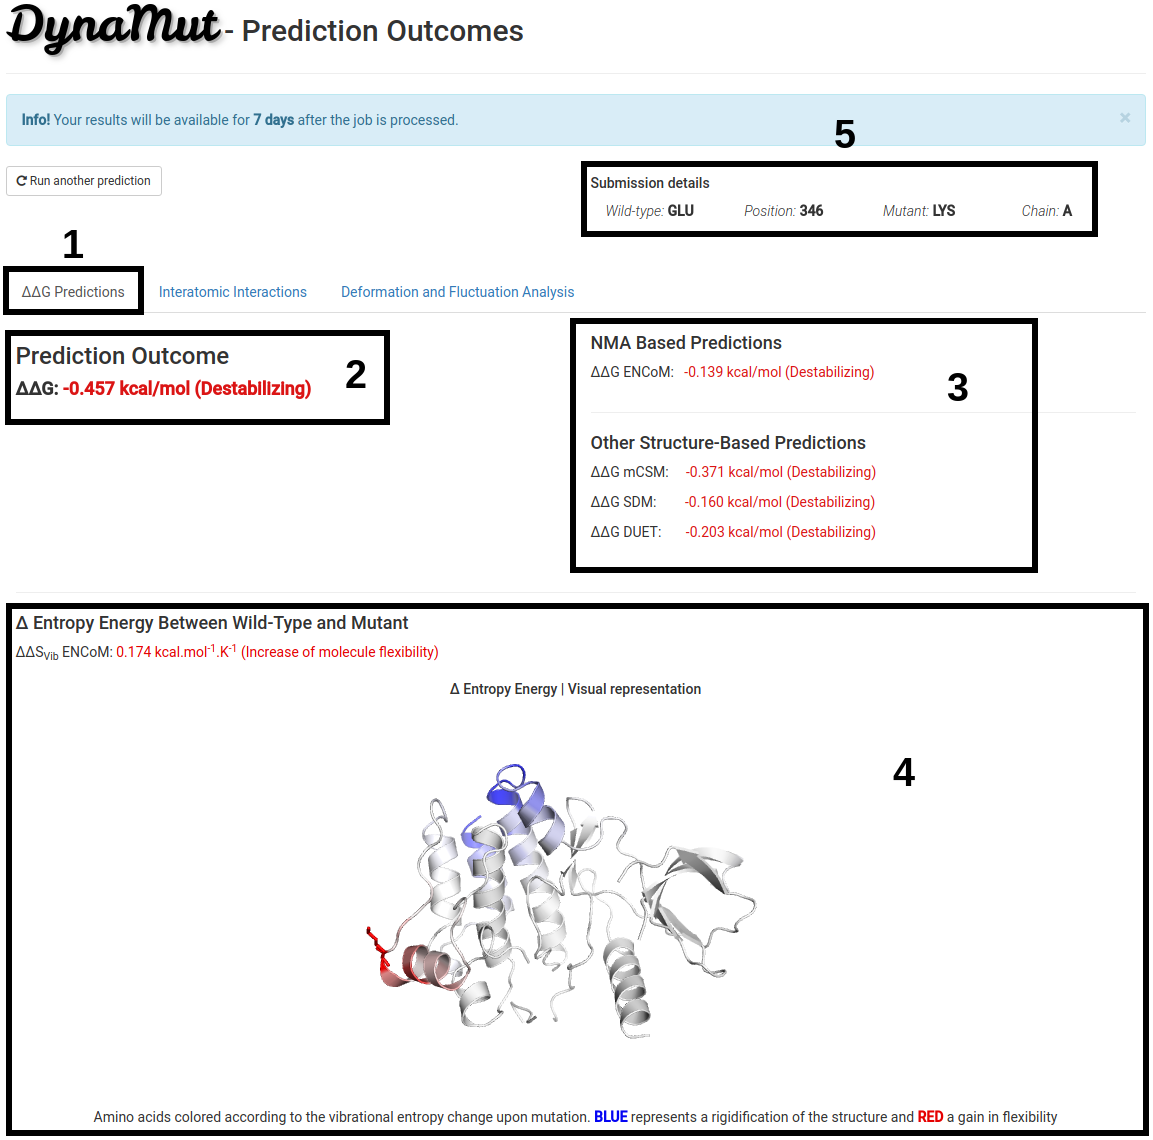
The results for a single mutation will be displayed once computations are completed in 3 different panels. On the first tab, ΔΔG Predictions (1):
- (2) Shows the ΔΔG predictions of DynaMut.
- (3) Shows the ΔΔG predictions for well-stablished methods that are based on protein structure using different approaches and assumptions (machine learning, NMA, substitution tables) for comparison purposes.
- (4) Displays the Vibrational Entropy difference (ΔΔS) between wild-type and mutant structures calculated with ENCoM. A visual representation of the chain in which the mutation occurs is also shown. Amino acids colored according to the vibrational entropy change upon mutation. BLUE represents a rigidification of the structure and RED a gain in flexibility.
- Since processing time may vary depending on the structure submitted, the submission details are provided on the top-right of the page (5).
- All the images, pymol session and file with the ΔΔS for each amino acid used to generate the 3D visual representation are available for download.
- All results will be available for 7 days after the job is processed.
Prediction Results page
Interatomic Interactions
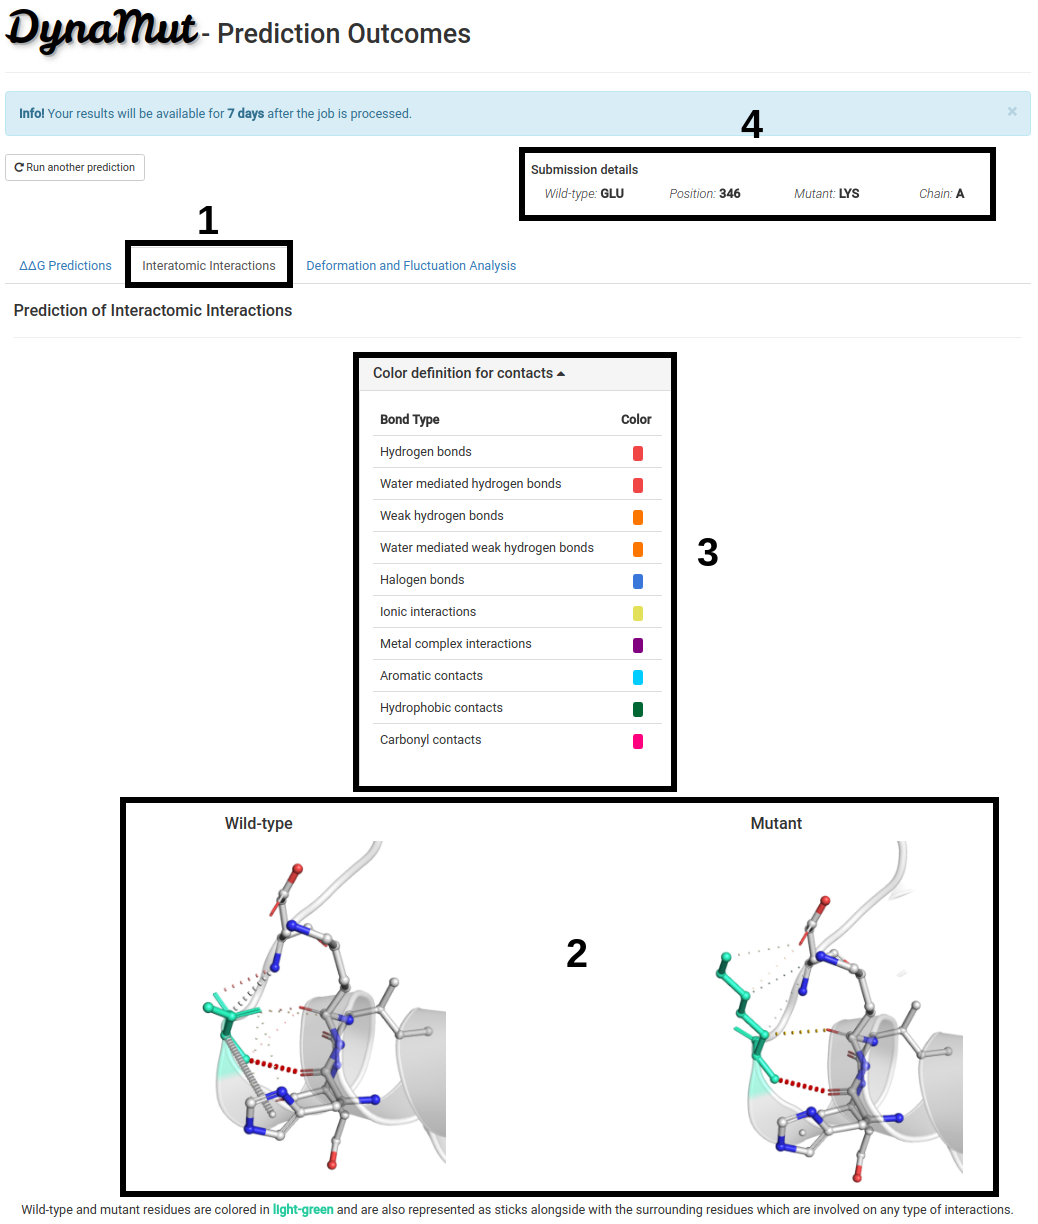
The second tab, Interatomic Interactions (1):
- (2) Shows the interactomic interactions predicteds for wild-type and mutant structures.
- A table with the color definitions for each type of interactions is also displayed (3).
- Since processing time may vary depending on the structure submitted, the submission details are provided on the top-right of the page (4).
- All the images and the pymol session used to generate them are available for download.
- All results will be available for 7 days after the job is processed.
Prediction Results page
Deformation and Fluctuation Analaysis
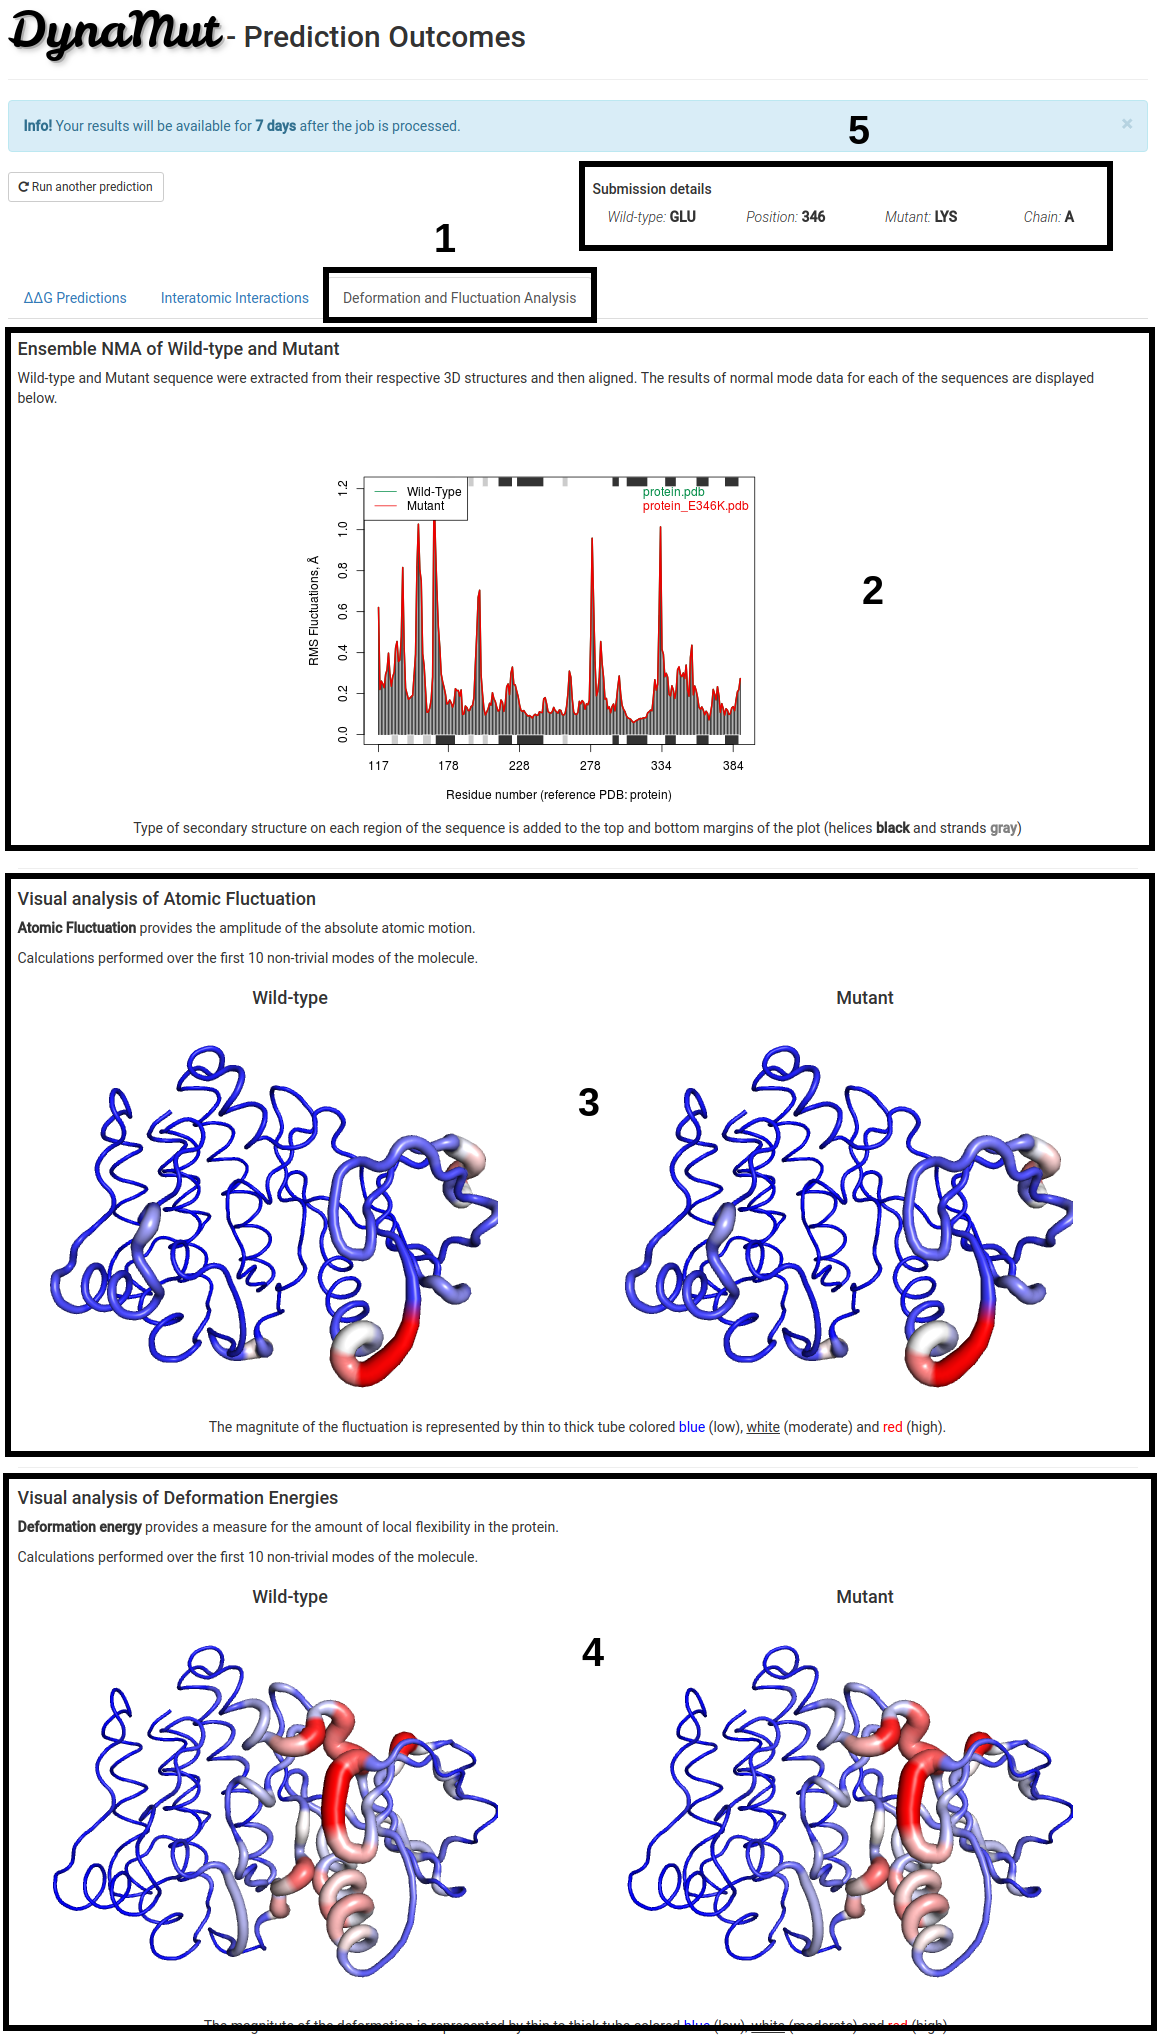
The third tab, Deformation and Fluctuation Analysis (1):
- Ensemble NMA of wild-type and mutant structure is shown (2). Sequence for both structures were extracted, aligned and displayed on a 2D representation highlighting the RMS Fluctuation in angstrons (Å) for each one of the residues. Type of secondary structure on each region for both sequences is added to the top and bottom margins of the plot (helices black and strands gray).
- 3D Visual representation of atomic fluctuation (3) and deformation energies (4) of wild-type and mutant structures are shown. Calculations were performed over the first 10 non-trivial modes. The magnitute of the fluctuation is represented by thin to thick tube colored blue (low), white (moderate) and red (high).
- Since processing time may vary depending on the structure submitted, the submission details are provided on the top-right of the page (5).
- All the images, pymol sessions and additional files with the values for atomic fluctuation and deformation energies used to generate the 3D visual representations are available for download.
- All results will be available for 7 days after the job is processed.
Prediction Results page
Prediction Results - List of Mutations
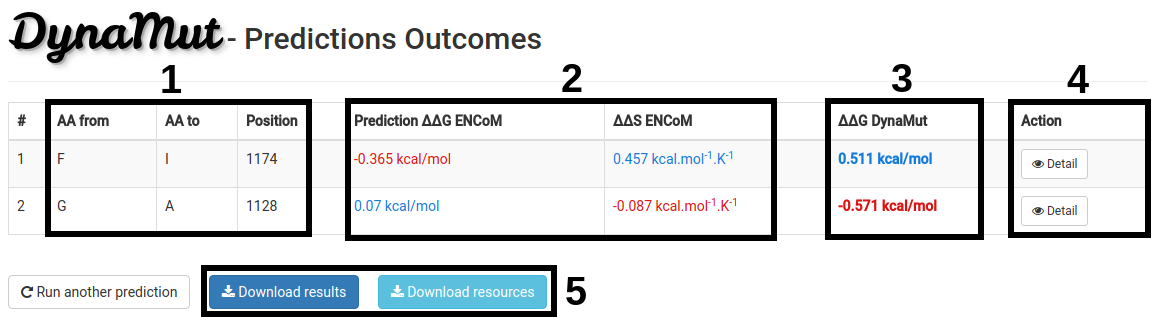
The results for a list of mutations will be displayed in a table format with the following information:
- Wild-type and Mutant residue code, and mutation position(1).
- The ΔΔG and Δ Entropy Energy predictions by ENCoM between wild-type and mutant structures(2).
- The ΔΔG predictions of DynaMut (3).
- Complete analyses can be performed for each one of the mutations on the list using the Detail button (4).
- An option to download the predictions as a tab-separated file and all the resources generated during the prediction for all mutations are also available (5).
- All results will be available for 7 days after the job is processed.
Contact page
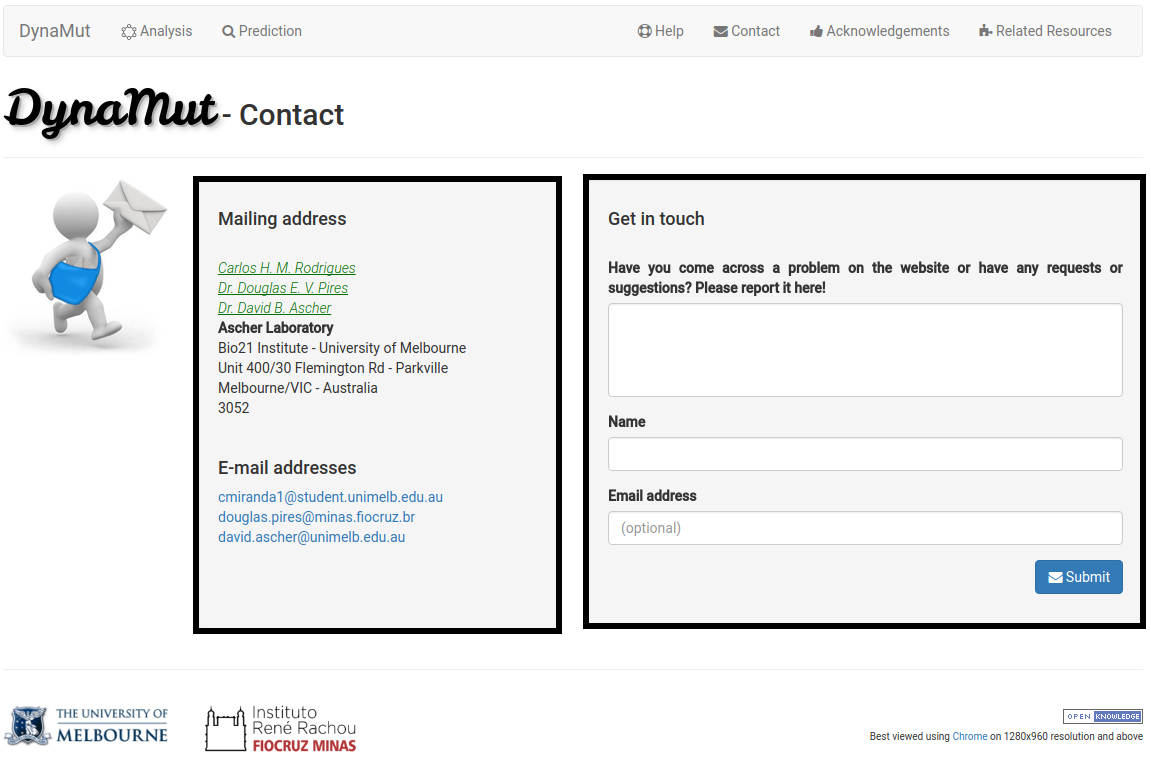
Getting in touch
In case you experience any trouble using Dynamut or have any suggestions or comments, please do not hesitate in contacting us either via e-mail (1) or through the online form (2) .