Help
About mCSM-PPI2
mCSM-PPI2 is a user friendly web server that implements an intergrated computational approach for predicting effects of missense mutations in protein-protein affinity.
Our method uses an optimised graph-based signature approach to better assess the molecular mechanism of the mutation, by modelling the effects of variations on the inter-residue non-covalent interaction network using graph kernels, evolutionary information, complex network metrics and energetic terms.
Running predictions
User Input Mutations
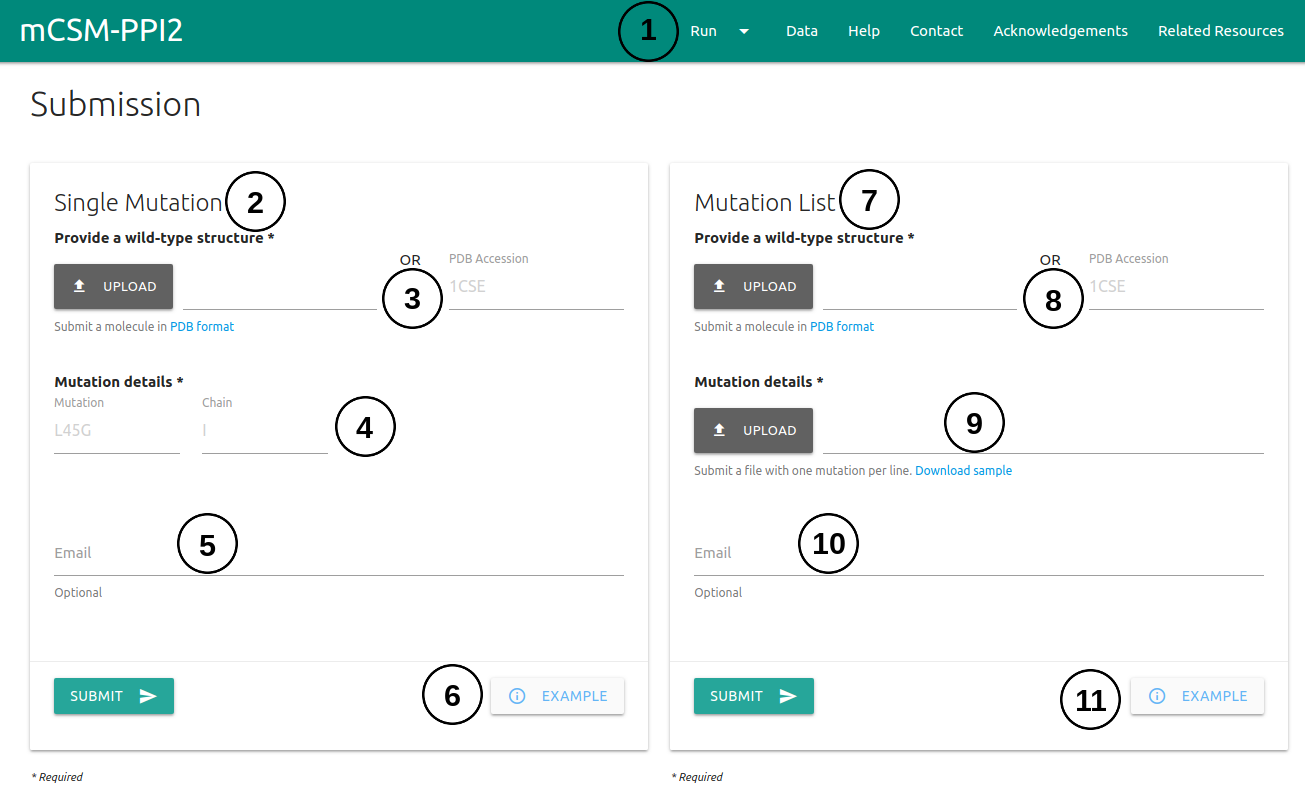
The submission page for user input mutations can be accessed via the menu item Run (1) on the top bar menu.
- The Single Mutation (2) option allows the user to submit one single mutation for prediction.
- Users are required to provide a wild-type structure (3) by uploading a file in PDB format or providing a PDB accession code.
- Details on the single mutation are should be provided (4) A mutation code consists of a wild-type code, residue position and mutant code (using the one letter amino acid code). The residue position must be consistent with the PDB file. The chain for the mutation must also be provided.
- If an email address is provided (5), a link to the results page will be sent to the useras soon as mCSM-PPI2 finishes processing the submission.
- An example of the results page is also provided (6).
- The Mutation List (7) option allows the user to submit a list of single mutations to be analysed by mCSM-PPI2 in batch.
- Similarly to the Single Mutation option, a wild-type structure is required (8) and can be input by uploading a file in PDB format or providing a PDB accession code.
- The list of single-point mutations must be input (9) by uploading a file containing the mutation codes (chain identifier, wild-type residue code, position and mutant residue code). The file format requires one mutation mutation per line. A sample file is also provided.
- If an email address is provided (10), a link to the results page will be sent to the useras soon as mCSM-PPI2 finishes processing the submission.
- An example of the results page is also provided (11).
Interface Analysis
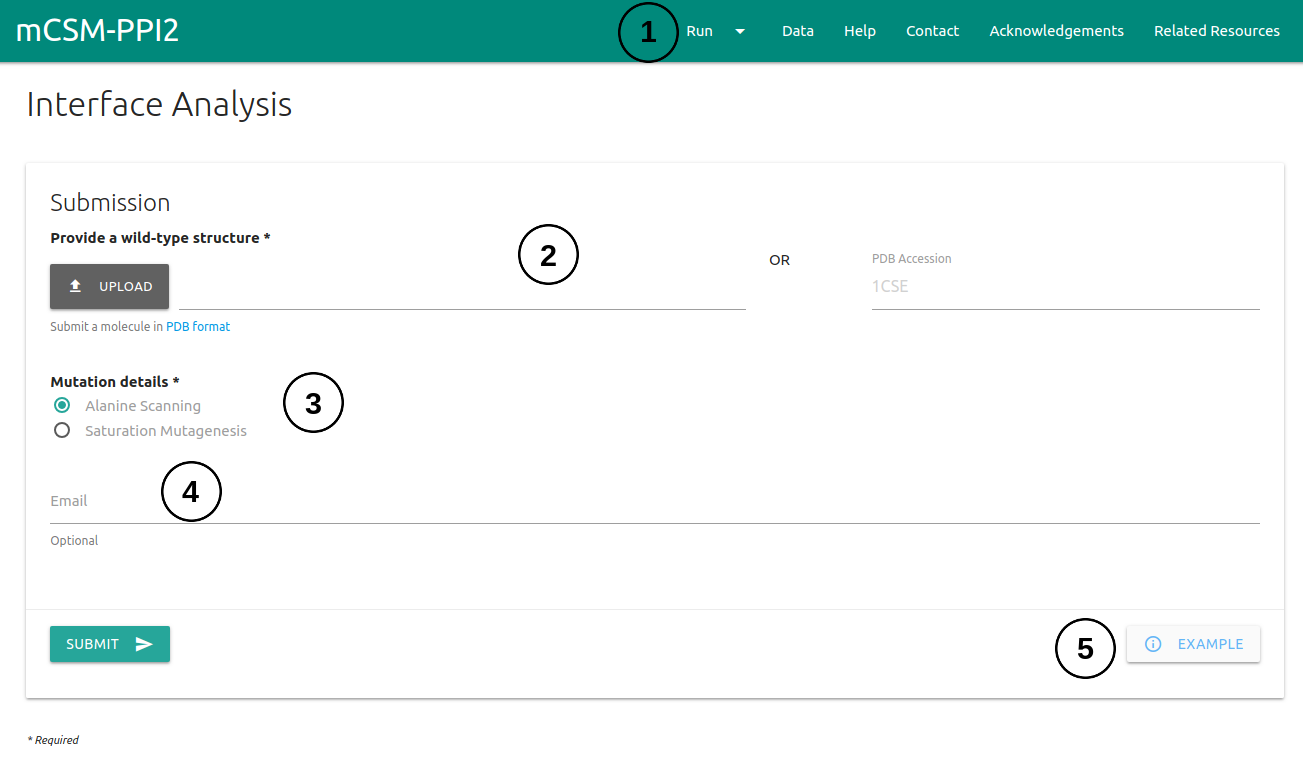
The submission page for automated interface analysis can be accessed via the menu item Run (1) on the top bar menu.
- Users are required to provide a wild-type structure (2) by uploading a file in PDB format or providing a PDB accession code.
- On Mutation Details section (3), one is required to provided which type of analysis to run. Here two options are available: Alanine Scanning (mutate all residues at the interface to Alanine) or Saturation Mutagenesis (mutate all residues at the interface to all 19 standard amino acids).
- If an email address is provided (4), a link to the results page will be sent to the useras soon as mCSM-PPI2 finishes processing the submission.
- An example of the results page is also provided (5).
Results
Single Mutation
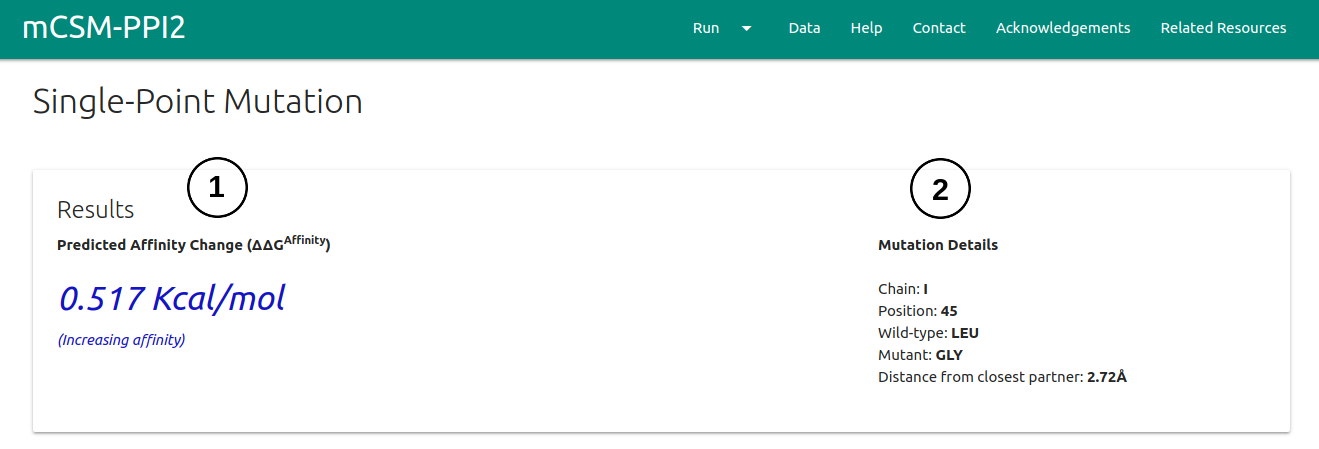
The results page for a single mutation will be shown once computations are completed in 3 different panels.
- On the first panel, the ΔΔG is displayed (1) alongside with the details on the mutation being analysed (2).
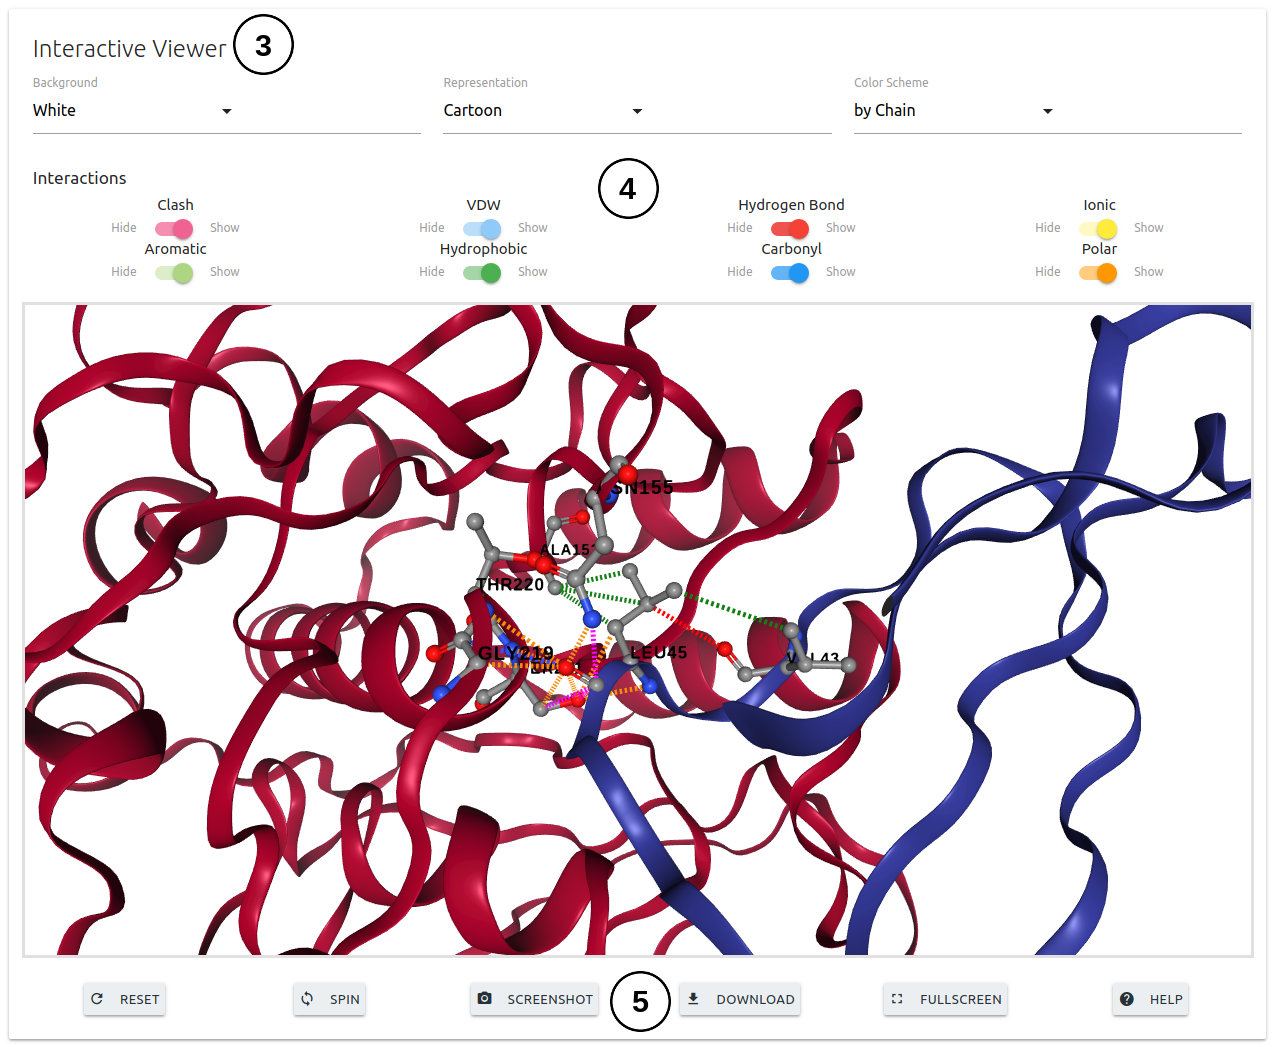
- The second panel will show and interactive 3D viewer (3), which allows user to analyse the interatomic interactions between the wild-type residue and nearby residues. Interactions can be hidden or displayed using the controles provided (4). The viewer can also be manipulated using buttons at the bottom of the panel (5).
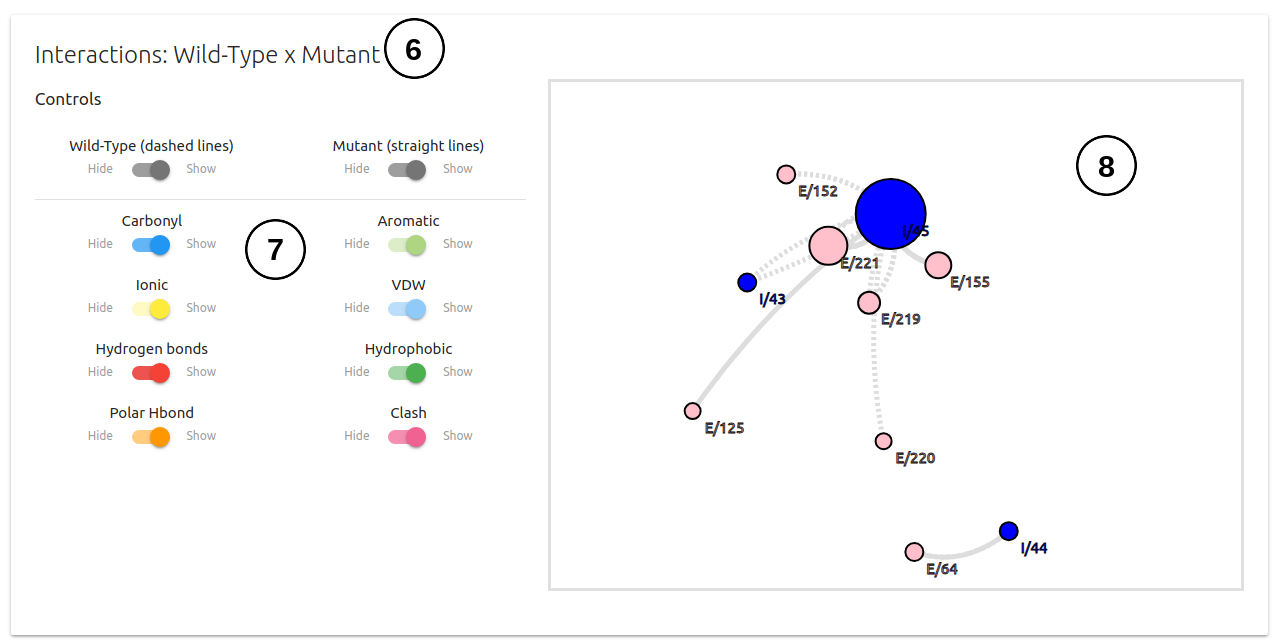
- Lastly, on the third panel, mCSM-PPI2 allows users to analyse the inter-residue interactions of wild-type and mutant(6). Here, a set of switches are also provided (7) to allow customisation of the interactions being displayed on the side box(8).
Mutation List
The results page for a list of single mutations will be shown once computations are completed in a single table.
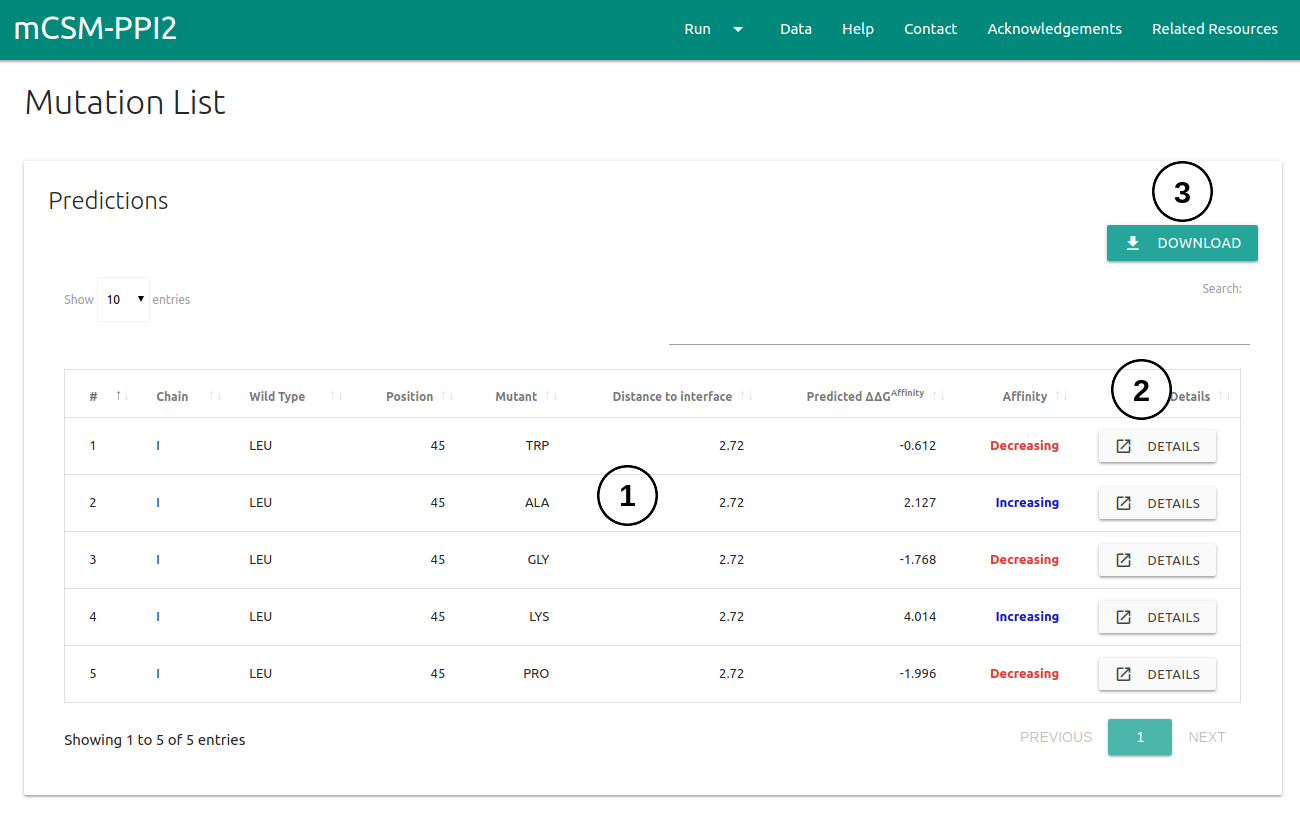
- The predicted ΔΔG for every single-point mutation will be displayed on a table (1). A set of controls for sorting based on columns and an input for text search are also provided.
- All the analysis discussed for the Single Mutation option can be analysed for each single mutation on the table through the Details button (2) of each row.
- Results can be downloaded as a .csv file by clicking on the Download button on the top right corner (3).
Interface Analysis
Alanine Scanning
The results page for Alanine Scanning will be displayed in three different panels.
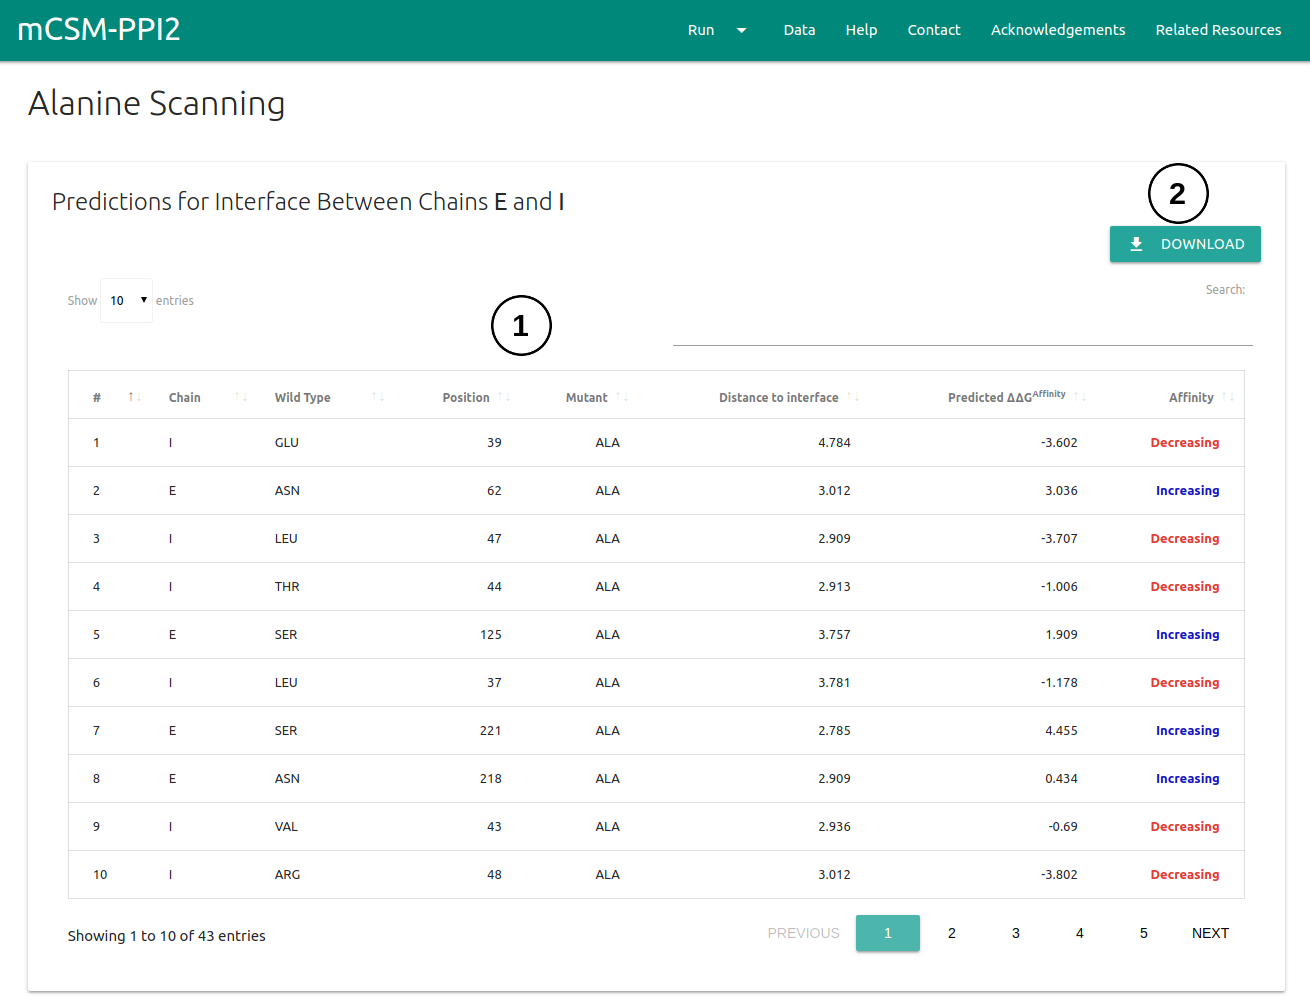
- The predicted ΔΔG for every single-point mutation to Alanine will be displayed on a table (1) on the first panel. A set of controls for sorting based on columns and an input for text search are also provided.
- Results can be downloaded as a .csv file by clicking on the Download button on the top right corner (2).
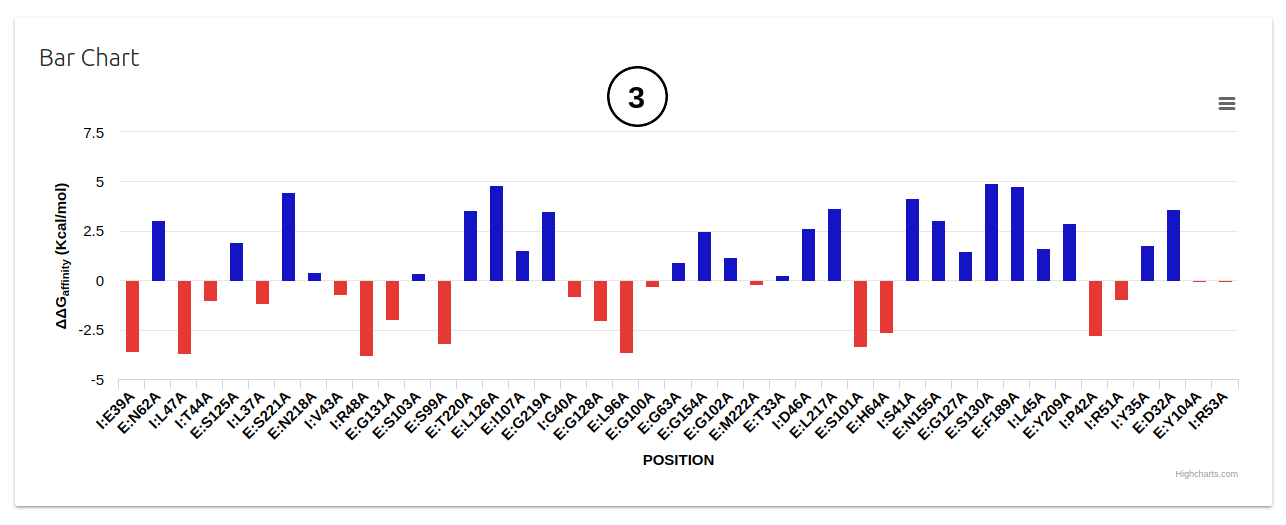
- All results are also summarised on a bar plot on the second panel (3). Positive and negative ΔΔG predictions are shown in in blue and red, respectively.
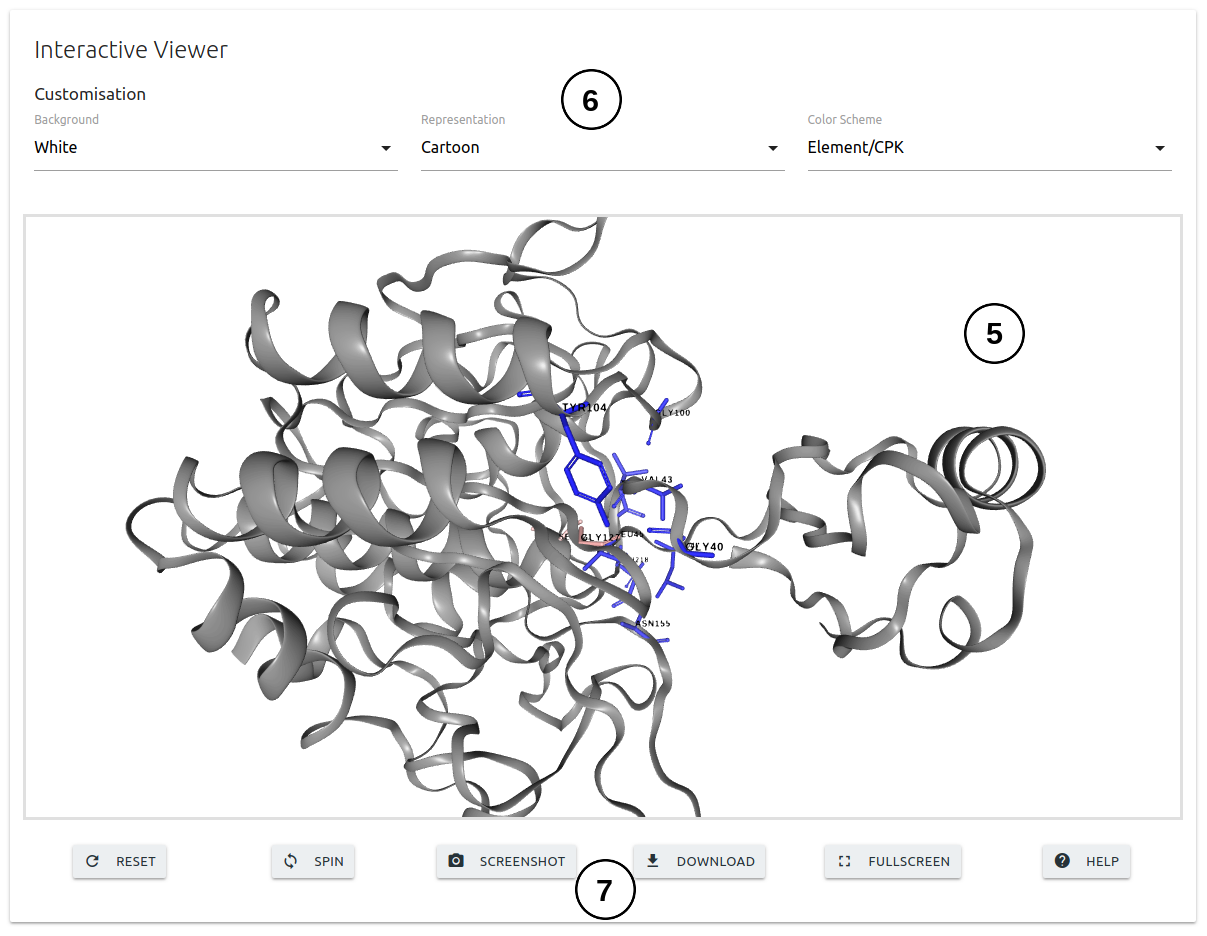
- The third panel will show and interactive 3D viewer (4) in which the interface residues are colored according to the ΔΔG predictions. The viewer can be customised using the controls on the top of the panel (5). A set of buttons are displayed at the bottom of the panel (6) to adjust visualisation.
Saturation Mutagenesis
The results page for Saturation Mutagenesis will also be displayed in three different panels.
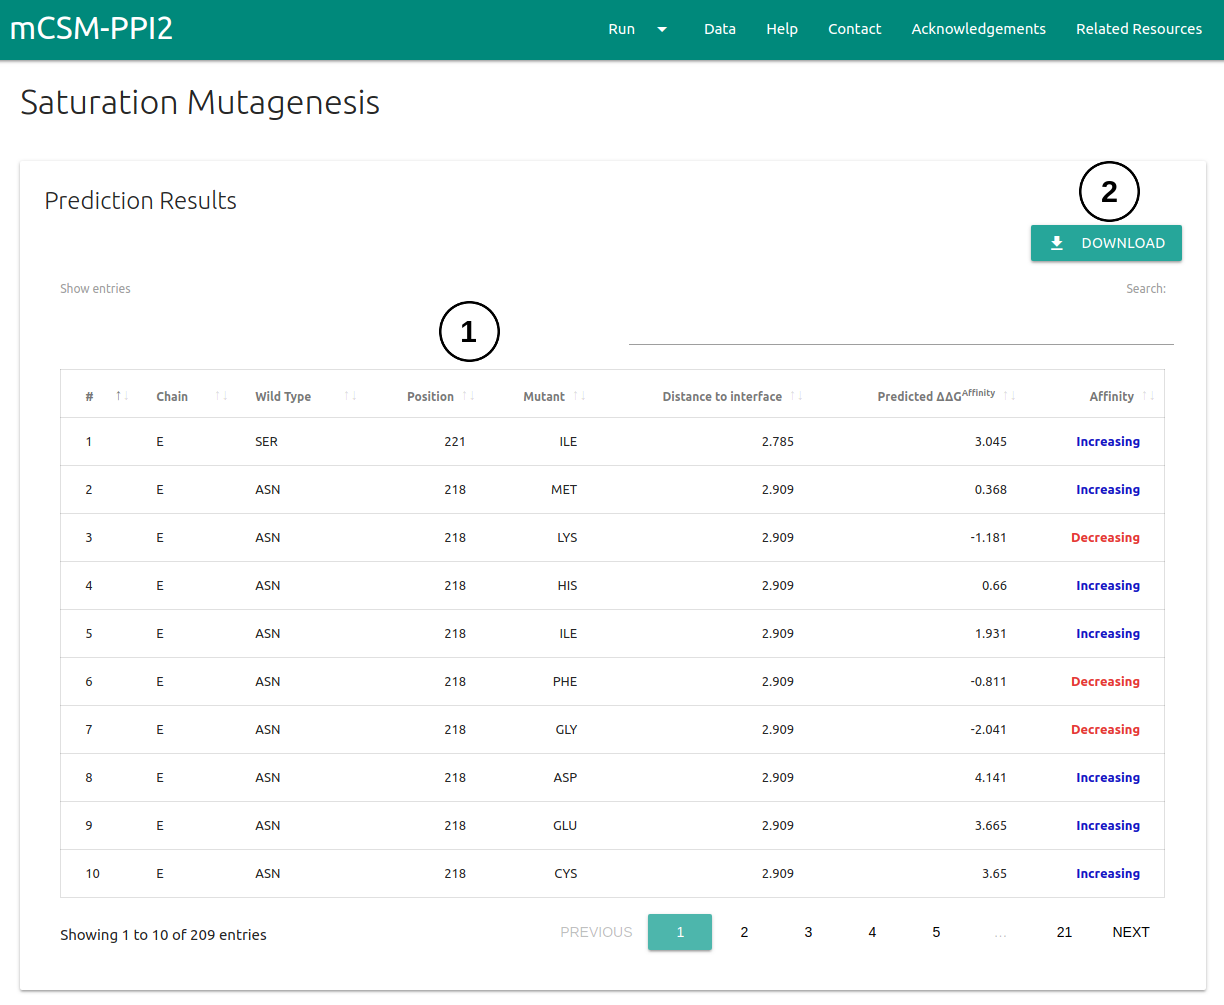
- The predicted ΔΔG for every single-point mutation to Alanine will be displayed on a table (1) on the first panel. A set of controls for sorting based on columns and an input for text search are also provided.
- Results can be downloaded as a .csv file by clicking on the Download button on the top right corner (2)
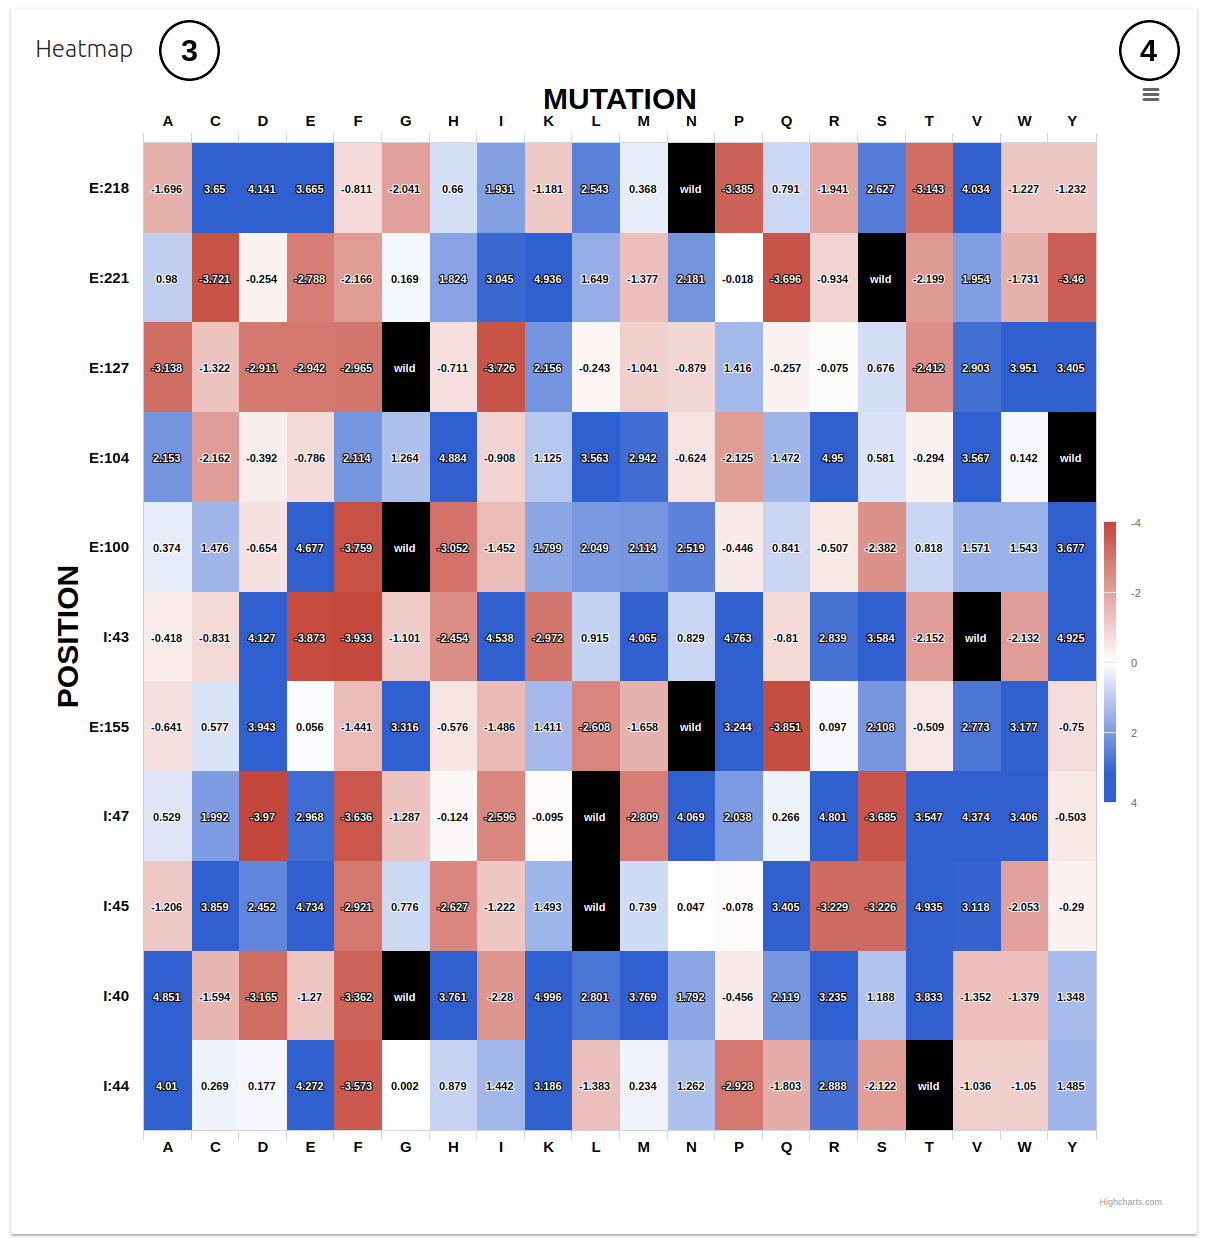
- All results are also summarised on a heatmap plot on the second panel (3) which can be downloaded as an image file (4).
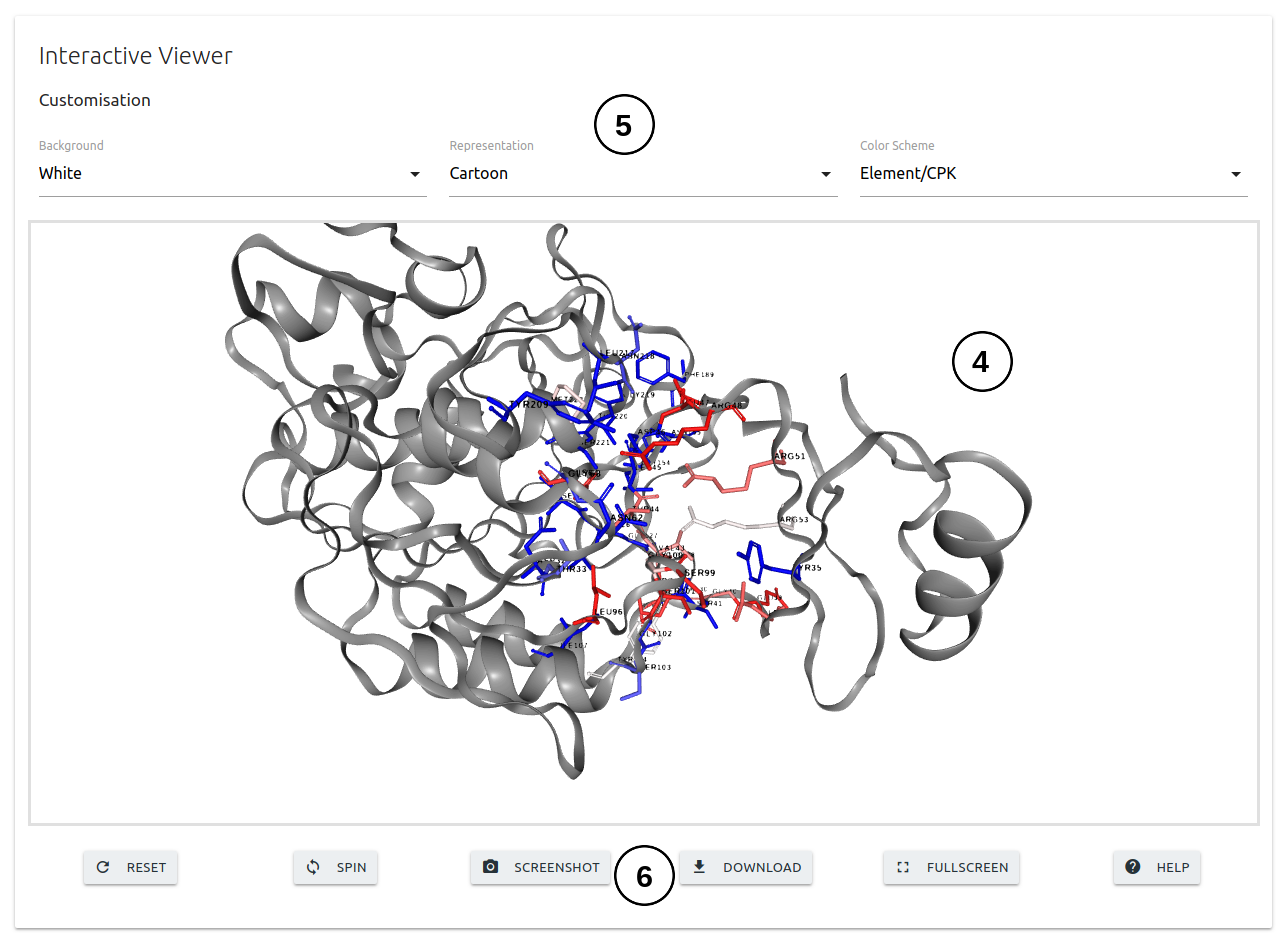
- The third panel will show and interactive 3D viewer (5) in which the interface residues are colored according to the average ΔΔG predictions values. The viewer can be customised using the controls on the top of the panel (6). A set of buttons are displayed at the bottom of the panel (7) to adjust visualisation.
Contact us
In case you experience any troube using mCSM-PPI2 or if you have any suggestions or comments, please do not hesitate in cantacting us either via email or via our Group website.
If your are contacting regarding a job submission, please include details such as input information and the job identifier