Overview
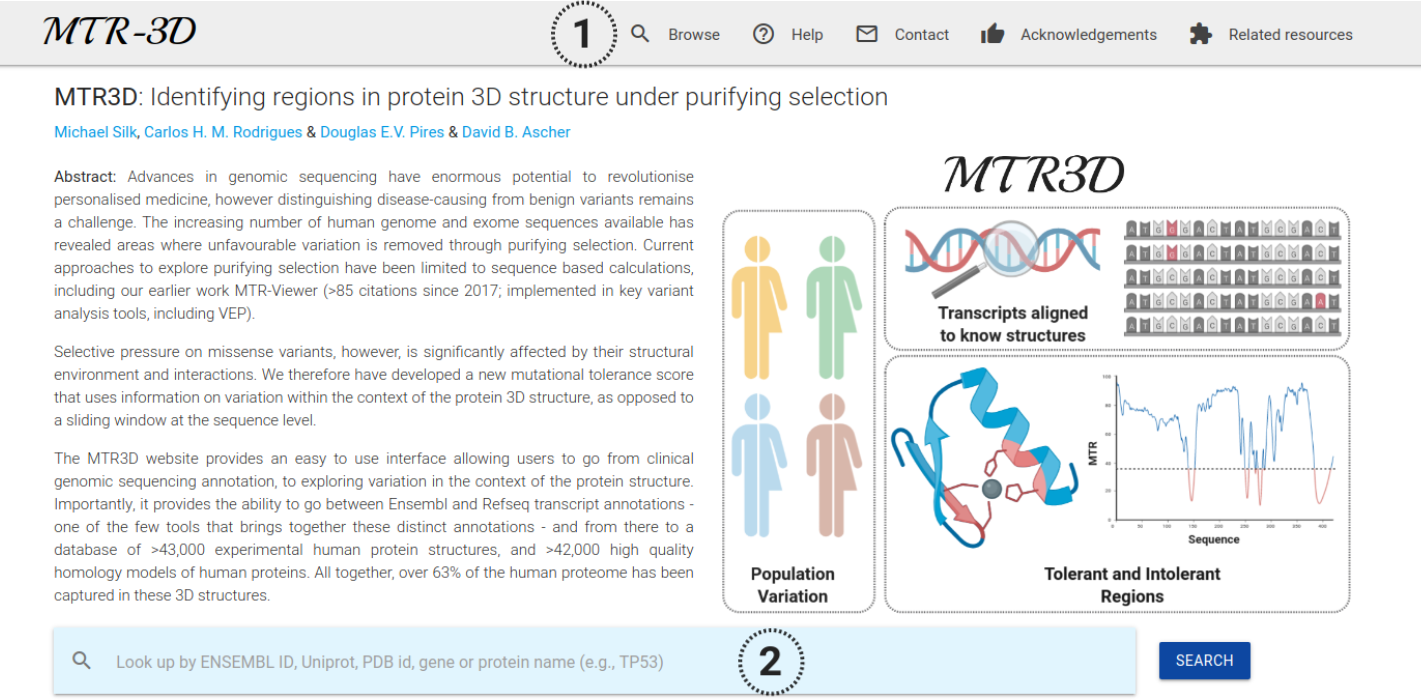
The MTR3D website provides an easy-to-use interface allowing users to go from clinical genomic sequencing annotation, to exploring missense variation in the context of the protein structure, enabling identification of regions under purifying selection.
Supported browsers: Chrome, Firefox, Opera and Brave.
Interpretation
The Missense Tolerance Ratio (MTR) aims to identify the extent of purifying selective pressure acting on missense or non-synonymous variants. MTR3D allows users to explore these through a 2D sequence-based representation and through a novel 3D structure based representation. An MTR score is derived by comparing an observed proportion of missense variation within standing variation from gnomAD and UK Biobank to an expected model that takes into local sequence and structural contexts. Regions with low MTR scores (MTR<1) imply intolerance to missense variants due to strong purifying selective pressure. Whereas regions with MTR=1 can be interpreted as being neutral.
Searching for a gene, transcript or protein of interest
MTR3D enables users to search for their protein of interest using Ensembl and Refseq transcript annotations, as well as searches by UniProt Accession ID, PDB IDs or HGNC gene symbol. From the Home page, depicted below, users have the option to either browse annotations (1) or perform a search (2).
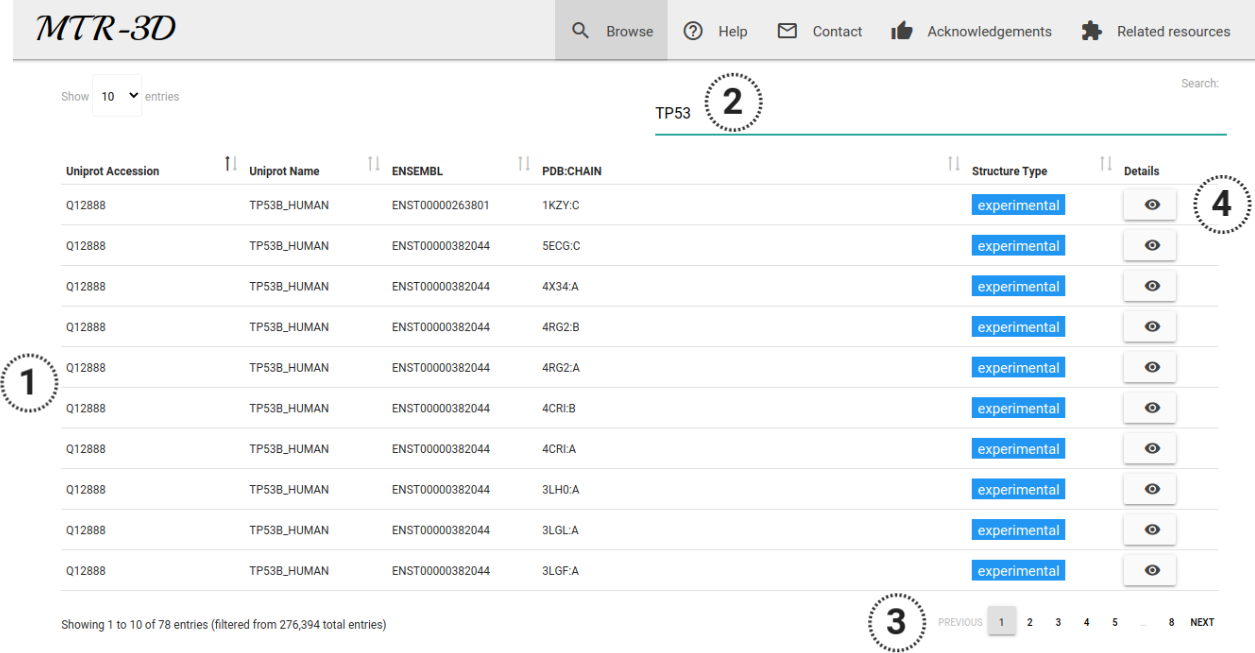
The results of the browsing mode or a specific search are shown as an interactive table (1) as depicted in the image below. In this case, a user provided the term "TP53" (2), which was matched with the Uniprot Q12888 and a range of Ensembl transcripts and protein structures. In total 218 records were identified and can be accessed via a pagination function (3). By clicking in the "Details" button (4) for a particular record, users will be redirected to the data visualisation page.
Using the MTR3D Viewer
The "Details" page for a particular entry is divided into three sections: controls and sequence-based representation, structure-based viewer and a downloads section.
Sequence-based representation
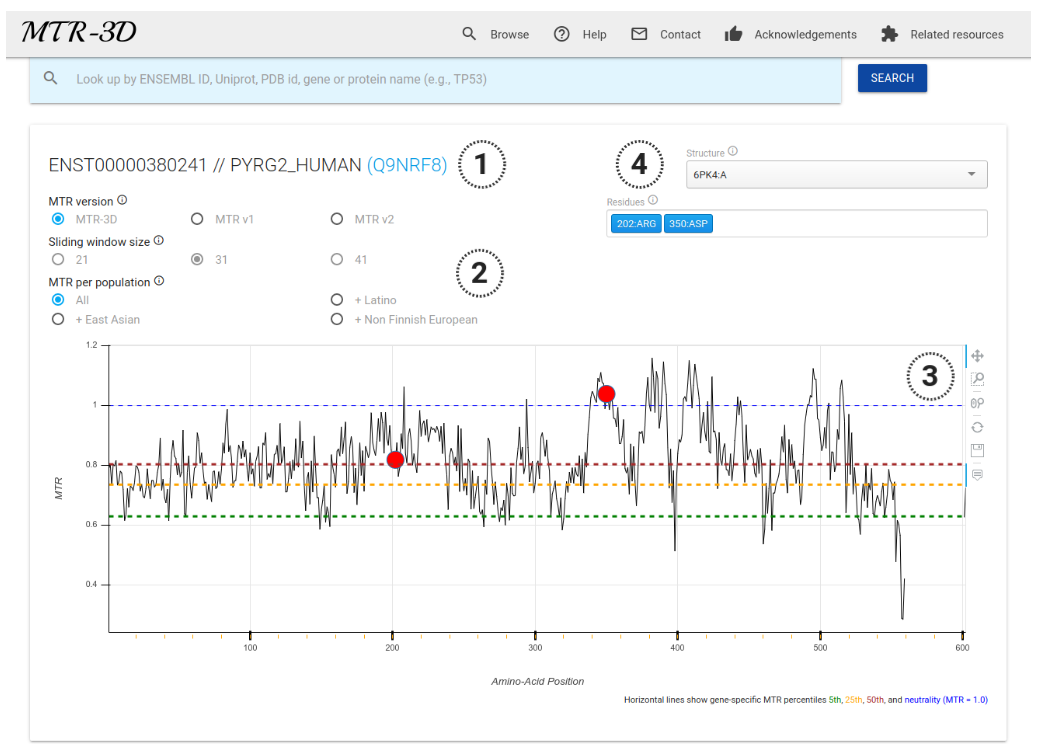
The sequence-based representation presents identifiers of the sequences (Ensembl Transcript ID and UniProt where available) (1). Users have the options to choose which scoring version to show (MTR3D, and MTR versions 1 and 2), as well as select different sliding window sizes (21-codons, 31-codons or 41-codons) and choose population-specific MTR calculations (including three populations: Latino, South Asian and Non-Finnish European) (2). The 2D MTR distribution for a gene is plotted across the protein-coding sequence (x-axis showing Amino-Acid Position). Users have the ability to zoom, pan and save the plot using right-hand control panel (3). Users have also the option to navigate through different available protein structures and highlight specific residues of interest (4), which will also be shown in the structure-based representation (if available).
Structure-based representation
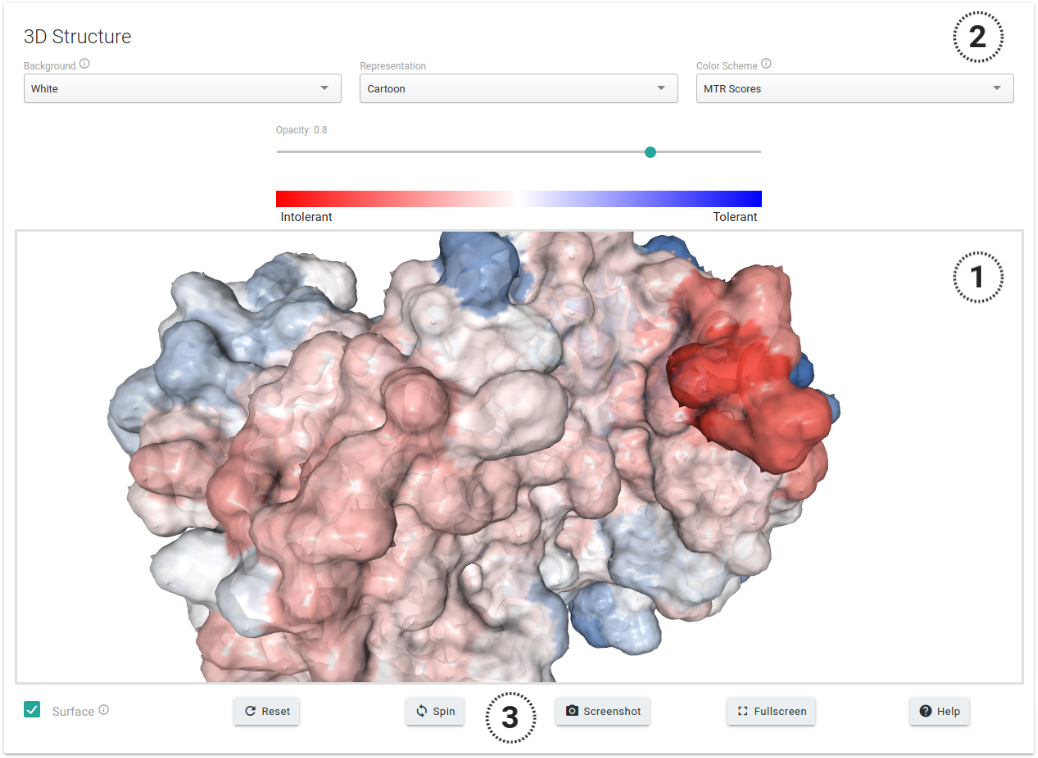
MTR3D encompasses all currently available human experimental structures in the Protein Data Bank (>43,000) as well as high quality homology models (>42,000), covering over 63% of the human proteome. If one or more structures or models are available, the structure-based section will be provided with an interactive 3D viewer (1), as shown in the figure below. In this, users will have the option to change colouring schemes (2), which by default will represent MTR scores in a scale of Intolerant (red) to tolerant (blue) to missense mutations. Further visualization options are also available (3).
Downloading MTR3D Data
Finally, users have the option to download the information presented within the “Details” page, including MTR3D and MTR v1 and v2 calculations as well as the protein structures shown (1).